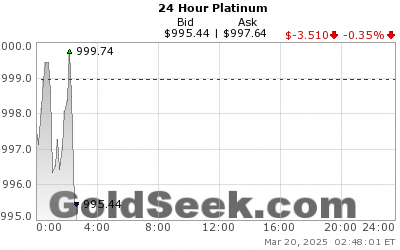
Pt Spot Price

| Platinum Prices - Historical Annual Data | ||||||
|---|---|---|---|---|---|---|
| Year | Average Closing Price | Year Open | Year High | Year Low | Year Close | Annual % Change |
| 2021 | $1,096.17 | $1,071.50 | $1,128.00 | $1,044.60 | $1,079.20 | 0.07% |
| 2020 | $893.39 | $985.00 | $1,078.44 | $596.80 | $1,078.44 | 10.44% |
| 2019 | $868.04 | $804.00 | $984.20 | $786.60 | $976.52 | 22.12% |
| 2018 | $882.18 | $947.80 | $1,032.10 | $771.90 | $799.66 | -14.70% |
| 2017 | $950.49 | $936.51 | $1,028.58 | $875.40 | $937.48 | 3.81% |
| 2016 | $988.90 | $891.10 | $1,176.25 | $818.45 | $903.10 | 1.30% |
| 2015 | $1,050.61 | $1,193.00 | $1,285.00 | $831.30 | $891.55 | -26.07% |
| 2014 | $1,383.62 | $1,388.00 | $1,512.00 | $1,178.00 | $1,206.00 | -11.13% |
| 2013 | $1,484.73 | $1,566.00 | $1,736.00 | $1,317.00 | $1,357.00 | -11.13% |
| 2012 | $1,550.89 | $1,406.00 | $1,729.00 | $1,390.00 | $1,527.00 | 12.78% |
| 2011 | $1,719.03 | $1,755.00 | $1,887.00 | $1,354.00 | $1,354.00 | -22.85% |
| 2010 | $1,611.51 | $1,500.00 | $1,786.00 | $1,475.00 | $1,755.00 | 20.12% |
| 2009 | $1,205.79 | $926.00 | $1,494.00 | $844.00 | $1,461.00 | 62.69% |
| 2008 | $1,571.04 | $1,541.00 | $2,273.00 | $763.00 | $898.00 | -41.46% |
| 2007 | $1,306.22 | $1,136.00 | $1,544.00 | $1,120.00 | $1,534.00 | 37.21% |
| 2006 | $1,142.40 | $982.00 | $1,355.00 | $982.00 | $1,118.00 | 15.85% |
| 2005 | $896.92 | $861.00 | $1,004.00 | $844.00 | $965.00 | 12.08% |
| 2004 | $845.83 | $815.50 | $936.00 | $767.00 | $861.00 | 5.90% |
| 2003 | $692.03 | $608.00 | $840.00 | $603.00 | $813.00 | 35.95% |
| 2002 | $539.99 | $481.00 | $607.00 | $453.00 | $598.00 | 24.58% |
| 2001 | $528.26 | $608.00 | $637.00 | $415.00 | $480.00 | -22.46% |
| 2000 | $544.42 | $443.00 | $622.00 | $414.00 | $619.00 | 39.73% |
| 1999 | $377.20 | $362.75 | $457.00 | $342.00 | $443.00 | 22.97% |
| 1998 | $371.82 | $367.50 | $429.00 | $334.25 | $360.25 | -0.76% |
| 1997 | $395.19 | $369.00 | $497.00 | $342.50 | $363.00 | -1.76% |
| 1996 | $397.26 | $400.00 | $431.50 | $367.00 | $369.50 | -7.22% |
| 1995 | $424.59 | $412.50 | $461.50 | $398.25 | $398.25 | -4.50% |
| 1994 | $405.60 | $397.00 | $425.50 | $378.00 | $417.00 | 5.84% |
| 1993 | $374.54 | $353.50 | $422.00 | $338.25 | $394.00 | 11.46% |
| 1992 | $360.02 | $337.50 | $391.00 | $332.75 | $353.50 | 4.51% |
| 1991 | $376.11 | $415.00 | $423.00 | $333.00 | $338.25 | -17.85% |
| 1990 | $471.29 | $475.25 | $532.00 | $391.50 | $411.75 | -15.71% |
| 1989 | $509.68 | $532.70 | $563.75 | $470.00 | $488.50 | -6.15% |
| 1988 | $530.29 | $495.50 | $623.50 | $446.00 | $520.50 | 4.10% |
| 1987 | $556.63 | $478.50 | $641.25 | $461.00 | $500.00 | 4.71% |
| 1986 | $465.29 | $341.30 | $675.50 | $341.30 | $477.50 | 40.32% |


Pt Spot Price Chart

What Is Platinum Worth
Metal Spot Price Charts Cobalt Price Chart (USD / Pound) for the Last Available years. Use this form to dynamically generate charts that show metal prices in the units of your choice and for the specified date range (if available). Simply select a metal and a unit to display the price. The spot price is the current market price of a security, currency, or commodity available to be bought/sold for immediate settlement. In other words, it is the price at which the sellers and buyers value an asset right now. Although spot prices can vary by time and geographic regions, the prices are fairly homogenous in financial markets. Conversion Diesel Fuel Price Price; 1 Liter ≈ 0,006 Barrel Diesel Fuel Price Per 1 Barrel 195.24 EUR 1 Liter = 0,001 m³. The Prices reflect Johnson Matthey’s current view of prevailing market prices and may take into account Johnson Matthey’s view on current market bids and offers. The Prices are for metal in sponge form with minimum purities of 99.95% for platinum and palladium, and 99.9% for rhodium, iridium and ruthenium. Interactive chart of historical daily platinum prices back to 1985. The price shown is in U.S. Dollars per troy ounce. The current price of platinum as of January 22, 2021 is $1,111.60 per ounce. Show Recessions Log Scale.